Metrics and measurement for nations’ circularity: the crucial piece to finish the circular economy puzzle
November 02, 2020
This blog, written by Laxmi Haigh, Science Writer, Journalist, and Lead Author of the Circularity Gap Reports at Circle Economy, gives some background on the upcoming change.’ organized by Circle Economy and Holland Circular Hotspot on November 12. Explaining what the circularity gap is and how metrics can help guide countries and regions towards a (national) circular economy.
Scroll all the way down to rewatch the webinar!

The Circularity Gap Report: a crucial framework that measures the current state and progress towards circularity
From a global pandemic to a warming planet scattered with climate disasters, the year 2020 arguably has provided us all the urgency to change. The circular economy has already cemented its position in global sustainable development dialogues, and now it also appears to be a strong basis for governments trying to make the notion of ‘build back better’ tangible. But where should nations focus their efforts, capital investments, and funnel their power for change in a circular transition? Understanding which actions are most pressing is dictated by the maturity of countries’ circular journey. To gauge their position in the transition, we need metrics and measurements to guide us.
‘On both a worldwide and national scale, a crucial framework that measures the current state and progress towards circularity is missing. Circle Economy’s Circularity Metric can provide a global or national yard-stick for progress’, comments Marc de Wit, director of the Circularity Gap Reporting Initiative (CGRI) at Amsterdam-based impact organisation Circle Economy.
Circle Economy’s consumption-based measurement (which measures all resources, materials and products that are used to provide for societal needs), the Circularity Metric, extracts a single measurement of circularity that reflects where a country, or the globe, is in its circularity journey. This also produces the Circularity Gap: the measure of materials which are wasted, lost or not usefully cycled back into the economy.
Photo: Refurbishment and repair are core tenets of a circular economy that must become mainstream to stem the globe’s overconsumption of scarce materials.
Nations: optimal first-movers for a circular economy
Launched during the World Economic Forum in Davos in January 2020, our third edition of the global Circularity Gap Report found that the global Circularity Gap had widened as circularity wilted from its 2018 value of 9.1% to 8.6%. In the face of this shrinking number, we asked: how powerful are countries in changing the game?
Countries are perfectly poised for action. They have the mandate to develop national legislation which creates an enabling environment for industry and business. They are also lead investors in infrastructure, government buildings and assets, so their procurement strategy can kick-start circularity at scale. As part of the Circular Construction Economy in the Netherlands, for example, the government has committed to ensure only circular contracts are procured from 2023 onwards. Nations are also the leading actors in supranational and multilateral coordination, via alliances such as the United Nations, the African Union and the European Union.
Although it is too early to fully reflect on the long-term impacts of the covid-19 crisis, an upcoming key condition of change for nations will be the mobilisation of capital. This is certainly happening around the world as stimulus packages are rolled out to rebuild fractured economies. Using data as a guide to identify pressure points in the economy, countries can funnel this capital toward circular economy initiatives such as renewable fuel sources and alternative business models.
Tapping into this potential are the Circularity Gap Reports. The methodology which gained worldwide recognition over the past three years can be scaled down to suit national contexts. Whilst placing a single measurement on how circular a national economy is, they sketch wide-ranging scenarios packed with tailored actions to increase the circularity of said economy.
Behind the metric: national blueprints
If the globe is 8.6% circular, how do individual countries compare? Three countries have already undergone the Circularity Gap Report treatment and attained their own Circularity Metric: Norway’s is 2.4%, the Netherlands’ is 24.5% and Austria’s is 9.7%. In Spring of 2021, we will unveil the results of our first gap analysis for a province: Quebec Canada.
Each Circularity Metric is based on an analysis of the national economy’s consumption. It probes how resources—metals, minerals, biomass and fossil fuels—are used to fulfill key societal needs and wants, such as Housing and Mobility. Crucially, each country has a unique consumption profile and no two are the same. This greatly determines the recommendations given on how to increase circularity in each context. These recommendations can aid governments and businesses in implementing circularity in an actionable—and measurable—way.
Norway: low metric, but a huge opportunity
Released in August 2020, our latest report found that Norway is 2.4% circular. It also identified that at 44.3 tonnes per person, per year, Norway has some of the highest global rates of consumption, per capita. In light of this, we aimed to not only reduce the Circularity Gap with our recommendations, but to also slash the overall material footprint of the country as much as possible.
But you may be wondering, why is Norway’s metric so much lower than the other countries analysed? This is due to a multitude of reasons. For example, as an active trading nation, a large proportion of Norway’s overall consumption originates from outside of Norway’s borders—it’s imported in. From nuts to t-shirts and laptops, these imports are diverse and inflate the overall material footprint, but are also hard to control for their circularity. Also, the data reflects the country’s exemplary recycling levels for high-value streams, such as plastics (64%) and glass (91%). But these high rates aren’t mirrored across all waste streams; despite the large amount of waste generated from its construction sector—20% of all waste generated in the country—only 28.8% is recovered.
With this unique context in mind, we crafted hypothetical circular interventions across six sectors. ‘Circular construction’, for example, would necessitate that existing materials are reused and cycled to reduce the demand for newly extracted and imported building materials. This could be achieved by sustaining and preserving what is already there, keeping building components and materials intact and ready for reuse, rather than reverting to the raw material level.
Meanwhile, for a ‘Circular food system’, the material footprint of the Norwegian diet could be lowered by consuming more local products, especially meat, dairy and cereals. To facilitate this, the government could lower value-added taxes for local products and ensure that the reductions in taxes would reach the final consumer, thereby encouraging a shift in demand and consumer behaviour.
In combining the varied interventions across the six scenarios that we modelled, we see a substantial impact: the Metric rises to 45.8% and the material footprint drops by 64.8%.
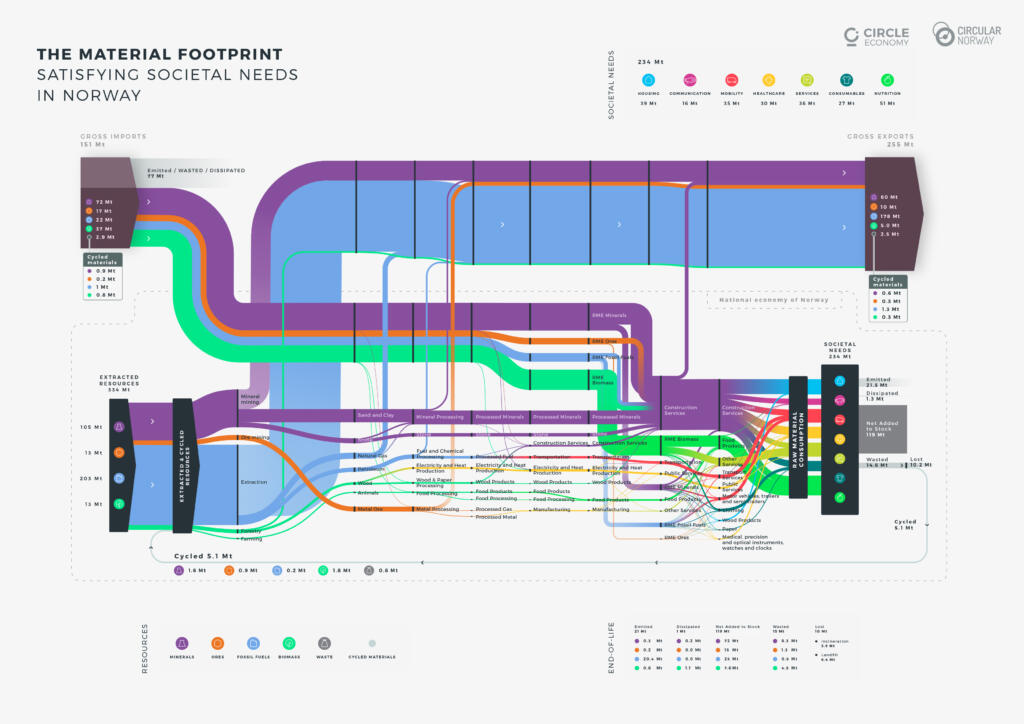
Image: Each report shares an x-ray of a nation’s economy: how materials are extracted (on the left), processed (in the middle) and are fed into satisfying societal needs (on the right). Here we see Norway’s economy.
The Netherlands: global frontrunner, but the pace needs to pick up
The Netherlands has a leading Metric of 24.5%. Government policy, technological innovation and investment direction towards increasing material efficiency and enabling end-of-life recovery have swelled its Circularity Metric far above the global average of 8.6%. But to stay on the right track and to reach the national goal of 50% circular by 2030 and 100% circular by 2050, major overhauls of four key sectors will be necessary.
We spotlighted the field of energy in our report. We highlighted that despite policy aimed at increasing the adoption of renewable energy, the economy is intensely fossil fuel-based and its percentage of energy coming from renewables is among the lowest in Europe. To achieve the government ambitions of a carbon-neutral economy by 2050, changes will be necessary. In our hypothetical analysis, halting all raw material imports and exports of fossil fuels meant that all domestic energy would be de-fossilized, thereby facilitating the shift to clean energy. And notably, given the Netherlands’ role as a heavy importer and exporter of fossil fuels, a trade that is galvanised by the large logistical hubs located in the ports of Rotterdam and Amsterdam, simply the de-fossilisation of its trade alone would have a large impact on the circularity of the country. To support this change, multiple parties along the supply chain and the government, especially in places where they are clustered together such as the Ports, would need to collaborate. This could be realised in the form of banning fossil-based products to galvanise a push for research into regenerative alternatives and foster more business support in the biochemical spaces.
We also dived into the Dutch construction sector. Again, the Netherlands proves itself as mature in its circle economy journey as it already aims for a construction sector that is 50% circular by 2030, and fully so by 2050. But barriers remain. For example, the small nation’s growing population means that in 2020 alone, there was an expected housing shortage of 300,000 units. The country also faces a nitrogen crisis which halted construction projects, which in turn further exacerbated the lack of housing. In light of these barriers on the ground, we examined hypothetical scenarios for advanced construction practices that can deliver homes in a material and energy-efficient way. For starters, all current residential housing and commercial properties could be kept in good order through renovations, refurbishment, upgrades and repurposing; thereby elongating the lifespan of the valuable materials within the infrastructure and preventing the need to extract further resources. Optimal building maintenance can be enhanced by leveraging digital technology, such as Madaster’s Material Passports.
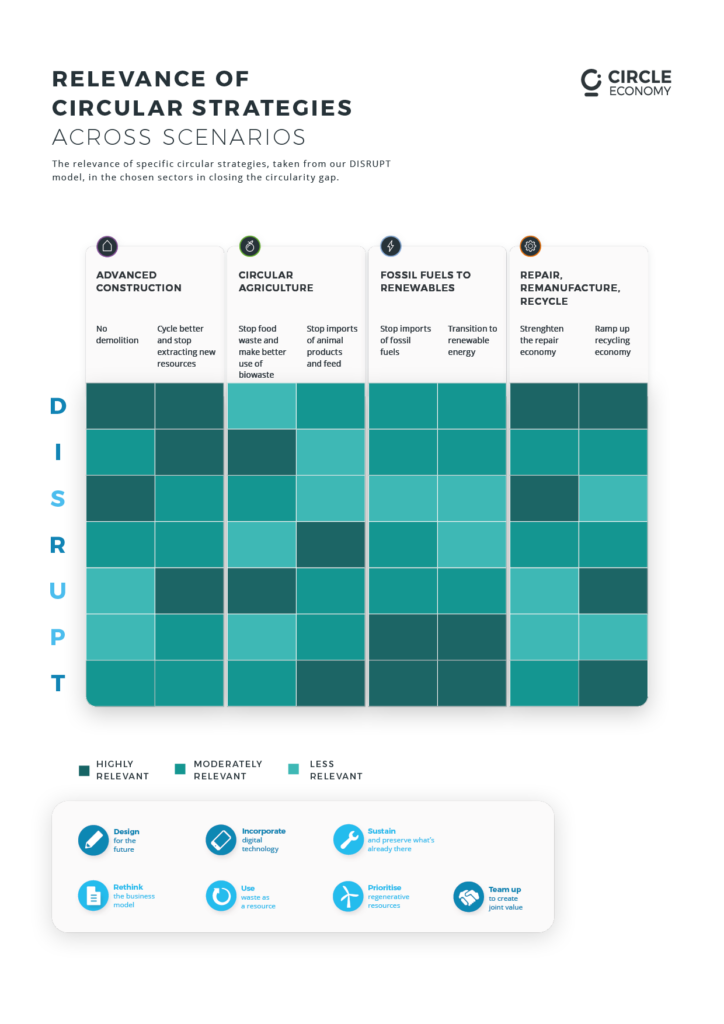
Image: We apply our Seven Key Elements framework across the scenarios we build for countries. In this heatmap, we can see which strategies (listed at the bottom) are most relevant for the Netherland’s circular economy transition (the darker the green the more relevant the strategy).
Austria: A recycling frontrunner
Austria’s report, which found it was 9.7% circular, marked our first national Circularity Gap Report. It became clear that the country touts outstanding recycling rates; four decades of dedicated policy and action means that now, 58% of all municipal waste is recycled. But still, the country’s (in 2018) Circularity Gap of 90.3% shows an overwhelming need for Austria to also radically reduce its primary material inputs, and waste and emission into nature. At the end of the day, recycling just fights the symptoms of the linear economy, without preventing the illness.
In this report, we not only considered interventions that targeted how the national economy worked, just like we did in the Netherlands and Norway, but also Austria’s collaboration with other countries. This is because in Austria over half of the material (consumption) footprint originates from outside of the country, meaning that it imports a huge amount of materials and products. Therefore, improving the circularity of imports would improve both Austria’s and the globe’s circularity. But this is a major challenge; materials imported or built into imported products are often beyond direct control of national actors. So, we spotlighted how Austrian businesses in international value chains need to collaborate to create joint value with their foreign partners, in order to improve the circularity of their products. The government could, for example, back EU tariffs that encourage circular products or work to enhance recycling in other domains. In creating a more level playing field regarding circular products, the Metric would jump from 9.7% to 20.1%.
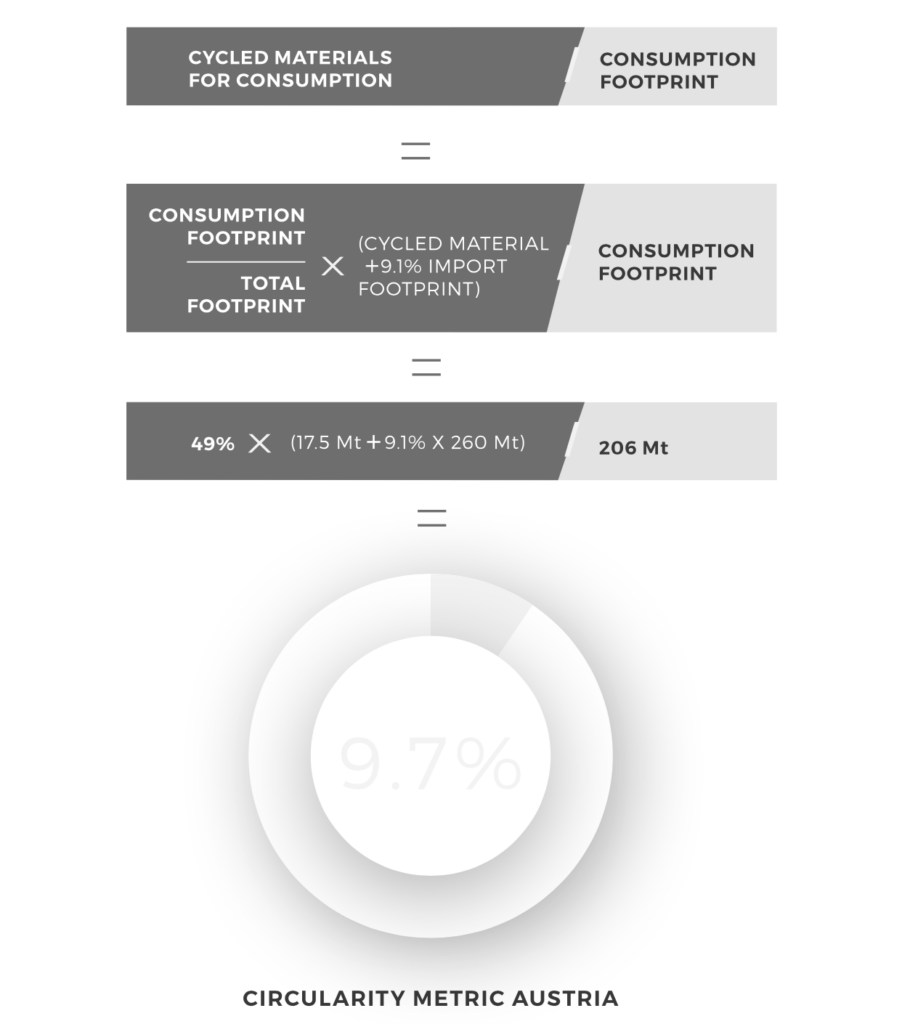
Image: This image breaks down how we use the country’s total consumption footprint and its share of cycled materials to calculate the metric, using Austria as an example.
Re-watch the webinar!
For detailed insights into the actionable pathways suggested to each country, you can download the full reports here. And to gain a deeper insight into our Circularity Gap Reports and hear from Norway, the Netherlands and Austria on their experiences of undergoing the treatment , re-watch the webinar with Holland Circular Hotspot below!